Home - Departments - Offshore Wind Development, Data Analytics, Forecasting & Information Technology (OWD, DAF & IT) - Wind Power Potential at 120m agl
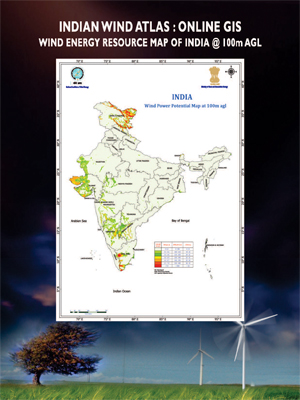
Under the direction of MNRE, NIWE has assessed India's wind power potential at 100m hub height with scientific rigor and based on authentic latest available data-sets of wind as well as land geologically spread across India. This information is essential for the Policy makers, Private players, Government Agencies and other stakeholders of the industry to move towards achieving the ambitious goal of 60,000 MW of wind power by 2022 as envisaged by the government. NIWE (formerly C-WET) had already performed the potential estimation study corroborating meso-scale derived wind maps and micro-scale measurements and released Indian Wind Atlas at 50mand indicative values at 80m hub heights with 5km resolution in April 2010 in collaboration with RISO-DTU, Denmark.
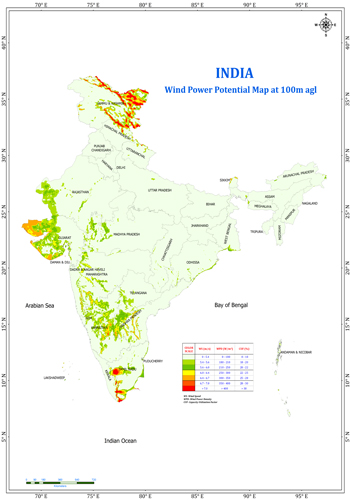
NIWE has chosen advanced modeling techniques and revisited this study as per the guidance and directives of MNRE / Govt. of India, with realistic and practical assumptions and estimated the wind power potential at 100m height as 302 GW. The present potential assessment has been carried out at a very high (10 times finer than 5km) spatial resolution of 500m, using the advanced meso-micro coupled numerical wind flow model, and with the corroboration of almost 1300 actual measurements spread all over India, which can be stated as first of its kind. In addition, the study has been performed with actual land availability estimation using NRSC 56m resolution Land Use Land Cover (LULC) Data (AWiFS) 1:250K scale and with consideration of 6MW / Sq.Km. Land features which are not suitable for wind farming has been excluded from the potential map with appropriate buffer/set-off. In addition, other developments such as roads, railways, Protected Areas, Airports, etc., have been excluded. Land area with elevation more than 1500m and slope more than 20 degree have also been excluded. The suitable land features have been grouped into 3 ranks (Rank I: Wasteland, Rank II: Cultivable Land and Rank III: Forest Land) and considerable weightage of 80% to Rank I, 30% to Rank II and 5% to Rank III has been assumed for the estimation. The map has been prepared in Capacity Utilization Factor (%CUF) scale and % CUF more than 20% has been considered for potential estimation.
| State | Rank I* | Rank II* | Rank III* | Total |
| Andhaman & Nicobar | 4.12 | 3.43 | 0.88 | 8.43 |
| Andhra Pradesh | 22525.50 | 20538.10 | 1165.00 | 44228.60 |
| Chhattisgarh | 3.24 | 57.03 | 16.31 | 76.59 |
| Goa | 0.00 | 0.08 | 0.76 | 0.84 |
| Gujarat | 52287.59 | 32037.83 | 105.09 | 84431.33 |
| Karnataka | 15202.36 | 39802.59 | 852.40 | 55857.36 |
| Kerala | 332.63 | 1102.56 | 264.38 | 1699.56 |
| Lakshadweep | 3.50 | 3.40 | 0.77 | 7.67 |
| Madhya Pradesh | 2216.39 | 8258.55 | 8.93 | 10483.88 |
| Maharashtra | 31154.76 | 13747.43 | 492.15 | 45394.34 |
| Odisha | 1666.20 | 1267.06 | 160.22 | 3093.47 |
| Puducherry | 69.43 | 79.00 | 4.40 | 152.83 |
| Rajasthan | 15414.91 | 3342.62 | 12.96 | 18770.49 |
| Tamil Nadu | 11251.48 | 22153.34 | 394.82 | 33799.65 |
| Telangana | 887.43 | 3347.52 | 9.34 | 4244.29 |
| West Bengal | 0.03 | 2.04 | 0.01 | 2.08 |
| Total in MW | 153019.59 | 145742.59 | 3489.31 | 302251.49 |
| Total in GW | 153 | 146 | 3 | 302 |
* Rank I – NRSC Level-II Classification Values: 12, 13, 15, 19
* Rank II – NRSC Level-II Classification Values: 2, 3, 4, 5, 6, 10, 18
* Rank III – NRSC Level-II Classification Values: 7, 8, 9
Even though advanced modelling techniques and authentic data sources have been used in this re-assessment study, due to the modelling nature and resolution, localized flow patterns were unable to be predicted properly at all the locations. Due to the above reason, there is a probability of marginal changes (upward/downward) in the estimated potential in individual states and also the states which are not mentioned above may also have potential in MW scale. The reader is expected to consider the potential with understanding the modelling limitations.