Home - Departments - Wind Resource Assessment - Estimation of Installable Wind Power Potential at 80 m level in India
In order to estimate the installable potential of the country, the KAMM generated meso scale wind power density map of 50 m level was integrated with the wind power density map generated with actual measurements (wherever data is available) and re-plotted the final wind power density maps by using GIS tool. Weightage is given only for the topographical features of the area. Later the total area of each wind power density range is calculated. Due to various reasons (habitat, forest, water bodies etc.), the entire land area covered by the isopleths cannot be expected to be available for installing wind farms. As land availability assessment was not a part of the project, the real land availability for wind farm development is not assessed for estimating the installable potential. On a conservative consideration, a fraction of uniform 2% land availability for all states except for Himalayan states, Northeastern states and Andaman Nicobar Islands has been assumed for energy estimation. In Himalayan states, Northeastern states and Andaman & Nicobar Islands, it is assumed as 0.5%. However the potential would change as per the real land availability in the windy area of each state. The installable wind power potential (name plate power) is calculated for each wind power density range by assuming 9 MW could be installed per square kilometer area . Finally the potential in the country at 50 m level with clearly stated assumptions is estimated as 49 GW (Refer Indian Wind Atlas published by NIWE for more information).
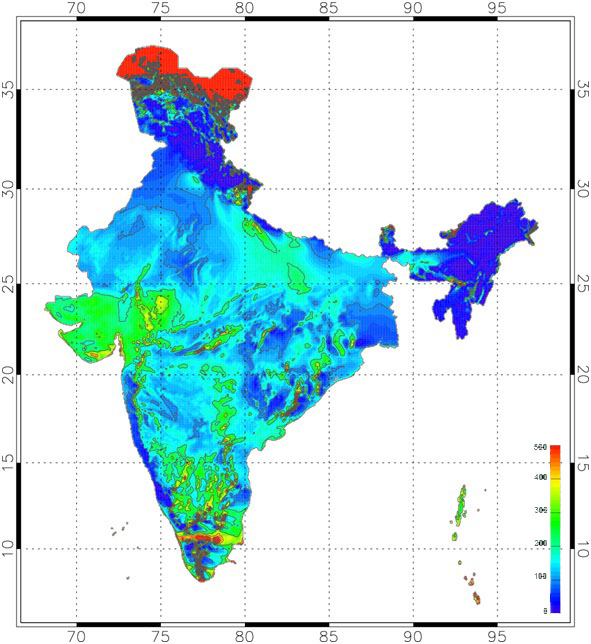
Similar exercise without any validation has been carried out for 80 m level with the KAMM generated meso scale map and the results are calculated and given in an attached table. The estimated installable potential at 80 m level is found to be 102788 MW (See the Table.1.). Wind power density map at 80 m level is given in figure 1.
| Sl.No | States / UTs | Estimated potential (MW)M | |
| @ 50 m ($) | @ 80 m (* #$) | ||
| 1 | Andaman & Nicobar | 2 | 365 |
| 2 | Andhra Pradesh | 5394 | 14497 |
| 3 | Arunachal Pradesh* | 201 | 236 |
| 4 | Assam* | 53 | 112 |
| 5 | Bihar | - | 144 |
| 6 | Chhattisgarh* | 23 | 314 |
| 7 | Dieu Damn | - | 4 |
| 8 | Gujarat | 10609 | 35071 |
| 9 | Haryana | - | 93 |
| 10 | Himachal Pradesh * | 20 | 64 |
| 11 | Jharkhand | - | 91 |
| 12 | Jammu & Kashmir * | 5311 | 5685 |
| 13 | Karnataka | 8591 | 13593 |
| 14 | Kerala | 790 | 837 |
| 15 | Lakshadweep | 16 | 16 |
| 16 | Madhya Pradesh | 920 | 2931 |
| 17 | Maharashtra | 5439 | 5961 |
| 18 | Manipur* | 7 | 56 |
| 19 | Meghalaya * | 44 | 82 |
| 20 | Nagaland * | 3 | 16 |
| 21 | Orissa | 910 | 1384 |
| 22 | Pondicherry | - | 120 |
| 23 | Rajasthan | 5005 | 5050 |
| 24 | Sikkim * | 98 | 98 |
| 25 | Tamil Nadu | 5374 | 14152 |
| 26 | Uttarakhand * | 161 | 534 |
| 27 | Uttar Pradesh * | 137 | 1260 |
| 28 | West Bengal* | 22 | 22 |
| Total | 49130 | 102788 | |
Table 1. Estimation of installable wind power potential at 80 m level
* Wind potential has yet to be validated with actual measurements.
# Estimation is based on meso scale modelling (Indian Wind Atlas).
$ As actual land assessment is not done on a conservative consideration 2 % land availability for all states except Himalayan & North eastern states, Andaman Nicobar Islands and Poor windy states has been assumed. In other area 0.5% land availability has been assumed.